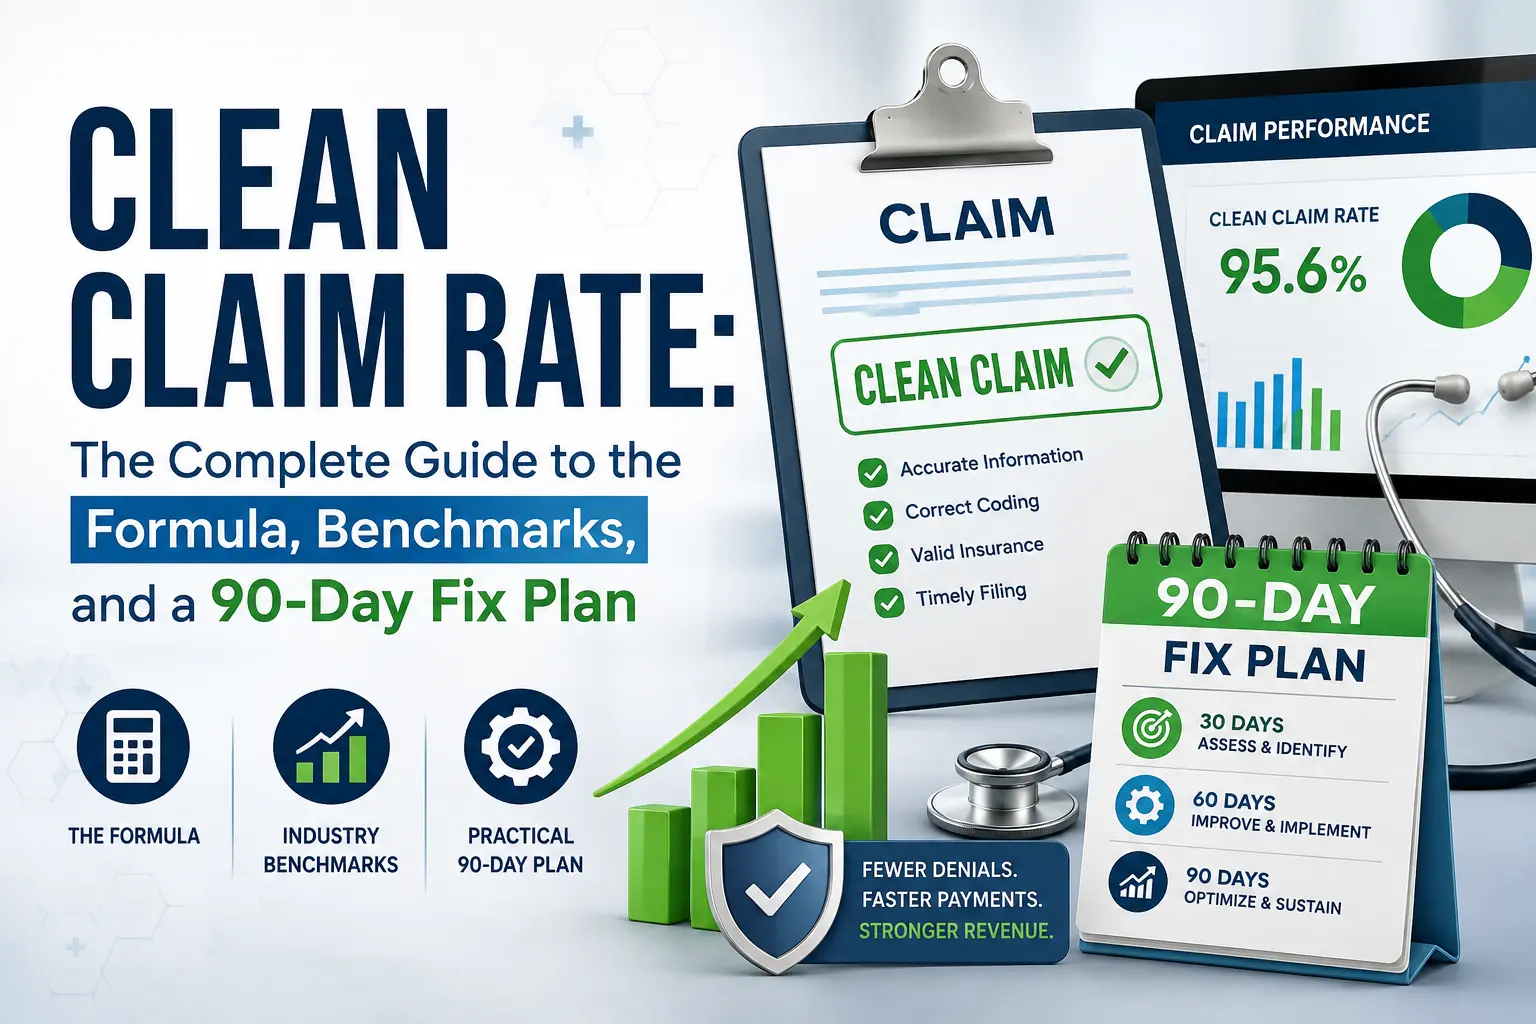
Quick answer: Clean claim rate is the percentage of claims that get accepted and paid by a payer on the very first submission, with no edits, rejections, denials, or requests for more information. You calculate it by dividing clean claims by total claims submitted, then multiplying by 100. Most practices sit somewhere between 75% and 85%. The organizations that run tight revenue cycles push past 95%, and some hit 98% or higher.
If that gap between “average” and “high-performing” sounds small on paper, it isn’t. On a practice billing 1,000 claims a month, the difference between an 80% clean claim rate and a 95% clean claim rate is 150 claims that need to be tracked down, corrected, and resubmitted every single month. That’s not a rounding error. That’s a part-time employee’s entire job, and it’s money sitting in accounts receivable instead of your bank account.
This guide covers everything the other articles on this topic leave out: the exact formula with a worked example, how clean claim rate compares to first pass yield and denial rate, what “good” actually looks like in 2026, where dirty claims really come from, and a practical 90-day plan you can hand to your billing team on Monday morning.
What Is a Clean Claim Rate?
A clean claim rate measures how many of your submitted claims sail through the payer’s system without a single hiccup: no missing information, no coding errors, no eligibility problems, no formatting mistakes. The claim goes out once and comes back paid.
There’s a stricter, more useful version of this definition that a lot of practices skip. A truly clean claim isn’t just one that clears the clearinghouse. It’s one that gets accepted by the payer and adjudicated and paid, with zero manual touches anywhere along the way. If you only measure clearinghouse acceptance, your number will look better than your actual financial reality, because a claim can pass clearinghouse edits perfectly and still get denied by the payer for a medical necessity issue, a timely filing problem, or a coordination of benefits mismatch.
Pick one definition, write it down, and apply it the same way every month. Consistency matters more than which exact definition you choose, because the real value of this metric is the trend line, not the single number.
Clean Claim Rate Formula
Here’s the formula, and it’s simpler than most practices treat it:
Clean Claim Rate = (Number of Claims Paid on First Submission ÷ Total Claims Submitted) × 100
Worked Example
Say your practice submits 850 claims in a month. Of those, 722 get accepted and paid on the first pass, with no edits, rejections, or additional documentation requests.
722 ÷ 850 = 0.849
0.849 × 100 = 84.9%
That practice is sitting right in the industry-average range, which sounds fine until you realize it means 128 claims went out the door and came back needing rework. If the average cost to research, correct, and resubmit a single rejected or denied claim runs somewhere in the range of $25 to over $100 depending on complexity, that one month of “average” performance quietly cost the practice thousands of dollars in labor alone, before accounting for the delay in cash flow.
What Counts as “Total Claims Submitted”?
This is where a lot of practices get their own number wrong. Total claims submitted should include every claim sent out the door in the measurement period, not just the ones that made it to the clearinghouse cleanly. If you strip out claims that failed pre-submission scrubbing before counting your denominator, you’re grading on a curve you set yourself.
Clean Claim Rate vs. Other Revenue Cycle Metrics
Clean claim rate gets used interchangeably with a few other terms, and that’s where a lot of confusion comes from. Here’s how they actually differ.
| Metric | What It Measures | Formula | Typical Benchmark |
|---|---|---|---|
| Clean Claim Rate | Claims accepted and paid on first submission, no edits or rework | Clean claims ÷ total claims submitted × 100 | 90%+ is a common goal; top performers reach 95–98% |
| First Pass Yield (FPY) | Whether a claim moves through the entire processing system correctly the first time, including internal workflow steps before it ever reaches the payer | Claims passing all internal edits without manual intervention ÷ total claims processed × 100 | Varies by organization; used to catch problems clean claim rate alone can miss |
| First Pass Resolution Rate | Claims fully resolved (paid or appropriately closed) without any rework cycle | Claims resolved on first attempt ÷ total claims × 100 | Often tracked alongside clean claim rate for a fuller picture |
| Denial Rate | Claims that were formally denied by the payer after adjudication | Claims denied ÷ total claims adjudicated × 100 | Lower is better; single digits is a common internal target |
| Zero Touch Rate | Claims that required absolutely no manual staff intervention before submission | Claims requiring zero manual edits ÷ total claims submitted × 100 | Higher-performing, automation-heavy operations track this as a leading indicator |
The practical takeaway: clean claim rate tells you what happens at the payer. First pass yield and zero touch rate tell you what’s happening inside your own building before the claim ever leaves. Denial rate tells you how often things went wrong badly enough to require a formal appeal. Serious revenue cycle teams don’t pick just one. They watch clean claim rate as the headline number and use the others to diagnose why it moves.
What Is a Good Clean Claim Rate? 2026 Benchmarks
There’s no single official number, but there’s enough consistency across industry sources to draw a reliable picture:
- Industry average: Most independent and group practices land somewhere between 75% and 85%.
- Healthy target: A clean claim rate of 90% or higher is a commonly cited baseline for a functioning revenue cycle.
- High performer: Leading revenue cycle organizations and larger health systems routinely operate in the mid-to-high 90s, with some benchmarking bodies pointing to 98% as the mark of a genuinely well-run billing operation.
Treat these ranges as directional. What matters more than hitting a specific published number is knowing your own baseline, measuring it the same way every month, and treating any sustained drop as an early warning sign rather than noise. A clean claim rate that falls three points in a single month almost always traces back to something specific: a payer changed a rule, a new hire is mis-keying data at check-in, or a code set updated and your scrubber wasn’t reconfigured for it.
Why the Range Is So Wide
Clean claim rate varies by payer mix, specialty, and claim complexity. A primary care practice billing mostly straightforward E/M visits to a handful of commercial payers will naturally post a higher rate than a multi-specialty group billing complex procedures across dozens of payers with different prior authorization rules, timely filing windows, and modifier requirements. Comparing your number to a single industry average without accounting for that context can be misleading. Compare your number to your own history first.
The Real Cost of a Low Clean Claim Rate
Every claim that fails on the first attempt costs a practice in three separate ways, and most owners only see one of them.
Labor. Someone has to identify the rejection, research the cause, correct the claim, and resubmit it. That’s work that produces zero new revenue. It only recovers money the practice already earned by delivering care.
Time. A reworked claim doesn’t just sit still, it restarts a clock. Days in accounts receivable climb, cash flow tightens, and the gap between delivering a service and getting paid for it widens with every resubmission cycle.
Leakage. This is the quiet one. Some rejected and denied claims never get worked at all, because staff are buried and the claim ages past the payer’s timely filing limit. At that point it’s not delayed revenue anymore, it’s a permanent write-off. A low clean claim rate is the single biggest feeder of this kind of silent revenue loss, and it rarely shows up on a monthly P&L in a way that’s obvious.
Run the math on your own volume: a practice submitting 1,000 claims a month at an 85% clean rate is reworking roughly 150 claims every single month. Push that rate to 95%, and rework drops to about 50 claims, same revenue, collected faster, with a fraction of the staff time and stress.
What Causes a Low Clean Claim Rate?
Most first-pass failures don’t originate in coding. They start earlier, at the front desk, long before a biller or coder ever touches the claim.
| Root Cause | What It Looks Like | Preventable at the Front End? |
|---|---|---|
| Registration and demographic errors | Misspelled names, wrong date of birth, transposed policy or subscriber numbers | Yes |
| Eligibility failures | Inactive coverage, wrong payer billed, unverified secondary insurance or carve-outs | Yes |
| Missing authorizations or referrals | Service rendered without the required prior auth or referral on file | Yes |
| Coding and modifier issues | Invalid or deleted codes, missing modifiers, diagnosis codes that don’t support medical necessity | Partially |
| Provider enrollment problems | Claim billed under a clinician not yet effective with that payer, or a mismatched NPI/tax ID combination | Yes |
| Payer-specific formatting rules | Quirks in how a specific payer wants a claim structured that generic clearinghouse edits don’t catch | Partially |
| Duplicate claims | The same service billed twice due to a workflow or system error | Yes |
Notice how many of those causes are “Yes” for preventable at the front end. That’s the pattern almost every practice misses: they build denial-fighting muscle on the back end, appealing claims after the fact, when the cheaper and faster fix lives at patient registration and eligibility verification, long before a claim is ever generated. Getting registration and coverage checks right the first time prevents the majority of these problems from ever becoming a claim issue at all. Tightening up general medical billing mistakes at every stage of the cycle, not just coding, is what actually moves this number.
How to Improve Your Clean Claim Rate: A 90-Day Roadmap
You don’t fix a chronically low clean claim rate with one memo to the billing team. It takes a sequenced plan.
Days 1–30: Audit and Baseline
- Pull your current clean claim rate using a strict, written definition: paid on first submission, zero manual touches.
- Run a rejection and denial report for the last 90 days and sort by root cause, not just by payer.
- Identify your top three rejection reasons. In almost every practice, three causes account for the majority of failures.
- Confirm your insurance eligibility verification process is actually happening 24 to 48 hours before every visit, not just for new patients.
Days 31–60: Fix the Upstream Process
- Retrain front desk staff on the specific data fields responsible for your top rejection reasons.
- Standardize documentation templates so they align with payer medical necessity requirements.
- Build or update claim scrubber edits for your top payers so errors get caught before submission, not after.
- Review your provider credentialing and enrollment status with every payer you bill, since a lapsed enrollment silently tanks clean claim rate for every claim tied to that provider. A structured medical billing compliance review at this stage catches problems most practices don’t find until a payer flags them.
Days 61–90: Build the Monitoring System
- Set up a monthly rejection Pareto report so you always know your top three causes, not just this month’s headline number.
- Assign clear ownership: someone specific is responsible for eligibility, someone specific owns coding accuracy, someone specific owns the monthly review.
- Evaluate whether your current medical billing software actually supports real-time eligibility checks and payer-specific scrubbing, or whether it’s creating manual work your staff shouldn’t be doing by hand.
- Set a realistic next-quarter target. Jumping from 78% to 95% in one quarter rarely happens. Jumping from 78% to 86% is achievable and compounds.
Ongoing: Make It a Habit, Not a Project
Clean claim rate isn’t a metric you fix once. It’s a number that drifts the moment you stop watching it, because payer rules change, staff turn over, and new codes get released every year. The practices that hold a 95%+ rate long-term are the ones that treat this as a standing monthly review, not a one-time initiative.
Clean Claim Rate Self-Audit Checklist
Run through this list before you assume the problem is “coding”:
- Do you verify eligibility for every visit, every time, not just for new patients?
- Is eligibility checked 24–48 hours before the appointment, giving staff time to fix problems before the patient walks in?
- Are your claim scrubber edits updated at least monthly, not quarterly?
- Do you track rejection reasons by root cause, not just by payer or dollar amount?
- Is provider enrollment status reviewed on a recurring schedule for every payer you bill?
- When a claim rejects, does someone trace it back to the workflow step that caused it, or does staff just fix the individual claim and move on?
- Do you audit a sample of paid claims periodically to confirm they were paid at the correct contracted rate, not just paid quickly?
- Is there one person accountable for the clean claim rate number each month?
If more than two or three of these are “no,” that’s usually where your leakage is hiding.
Technology’s Role: Automation and the Zero Touch Rate
A growing number of high-performing revenue cycle teams now track a second metric alongside clean claim rate: the zero touch rate, meaning the percentage of claims that require no manual staff intervention at all before they go out the door. Automated scrubbing tools can catch demographic mismatches, flag modifier conflicts, and check claims against real-time payer edits before submission rather than after a rejection comes back. Practices that layer this kind of automation on top of solid front-end processes tend to see meaningfully higher first-pass acceptance than those relying on manual review alone.
Technology helps, but it doesn’t replace the fundamentals. An automated scrubber built on top of a broken registration process just catches errors faster. It doesn’t stop them from being created in the first place. The highest-leverage fix is still upstream: accurate data collection and eligibility verification at the point of service.
Who Owns Clean Claim Rate in Your Practice?
This number fails when everyone assumes it’s someone else’s job. In a well-run revenue cycle:
- Front desk and registration staff own the accuracy of demographic and insurance data at check-in.
- Eligibility and prior authorization staff own confirming active coverage and required approvals before service.
- Coders own accurate code selection and modifier application that supports medical necessity.
- Billers own catching payer-specific formatting issues before submission and working the scrubber edits.
- Credentialing staff own keeping every provider actively enrolled with every payer the practice bills.
- Practice management or an outsourced revenue cycle management partner owns the monthly review, the trend line, and holding each role accountable.
When ownership is spread across five departments and reviewed by no one, clean claim rate quietly drifts downward. When one person is accountable for watching the trend and routing problems back to the right team, it stabilizes.
Common Myths About Clean Claim Rate
“A high clean claim rate means we’re getting paid correctly.” Not necessarily. A claim can be accepted and paid quickly at the wrong contracted rate. Clean claim rate measures speed and acceptance, not accuracy of payment. That’s a separate audit.
“Clean claim rate and denial rate are basically the same thing.” They’re related but not interchangeable. A claim can be rejected before it ever reaches adjudication, which hurts clean claim rate without ever becoming a formal “denial” that requires an appeal.
“If our clearinghouse acceptance rate is 98%, our clean claim rate must be too.” Clearinghouse acceptance only confirms the claim passed formatting edits. It says nothing about whether the payer will actually accept and pay it. These are two different checkpoints in the same process.
“This is a billing department problem.” The majority of what drags clean claim rate down starts at registration and eligibility verification, not in the billing office. Fixing it requires front-desk buy-in, not just a better biller.
Frequently Asked Questions
What is a clean claim in medical billing? A clean claim is one that’s accepted and paid by the payer on the first submission, with no rejections, denials, edits, or requests for additional information. The strictest definition requires the claim to actually be paid, not just accepted by the clearinghouse.
What is a good clean claim rate? A clean claim rate of 90% or higher is a commonly cited healthy baseline, with high-performing organizations reaching the mid-to-high 90s or better. Most practices currently operate between 75% and 85%, which leaves meaningful room for improvement.
How is clean claim rate calculated? Divide the number of claims paid on first submission by the total number of claims submitted, then multiply by 100. For example, 722 clean claims out of 850 submitted equals an 84.9% clean claim rate.
What’s the difference between clean claim rate and first pass yield? Clean claim rate measures what happens once a claim reaches the payer. First pass yield measures whether a claim moves correctly through your entire internal process, including steps before the claim ever leaves your building. Many organizations track both for a complete picture.
How often should I measure clean claim rate? Monthly is the practical standard for most practices, with a deeper quarterly review of rejection root causes. Measuring it the same way every time matters more than the specific frequency.
What causes most clean claim rate problems? The majority of first-pass failures trace back to registration and eligibility errors at the front end, not coding mistakes. Wrong dates of birth, inactive coverage, and missing prior authorizations are among the most common and most preventable causes.
Can outsourcing medical billing improve clean claim rate? Yes, in many cases, because scrubbing, rejection tracking, and payer-edit maintenance become someone’s dedicated responsibility rather than a side task squeezed in between other duties. Practices working with a disciplined medical billing services partner often see this metric improve simply because it finally has a full-time owner.
Where to Go From Here
Clean claim rate is one number, but it reflects the health of your entire revenue cycle, from the moment a patient calls to schedule to the moment the payer releases payment. If your rate has been stuck below 90% and you’re not sure whether the problem is registration, eligibility, coding, credentialing, or all four, an outside audit is usually the fastest way to find out.
The Billing Advisors works with practices to run a full root-cause analysis on claim rejections and denials, tighten up front-end verification, and build the ongoing monitoring that keeps a high clean claim rate from slipping back down. If you’d like a second set of eyes on your numbers, reach out to our team and we’ll walk through what’s actually driving your rejections, not just what the surface-level report shows.