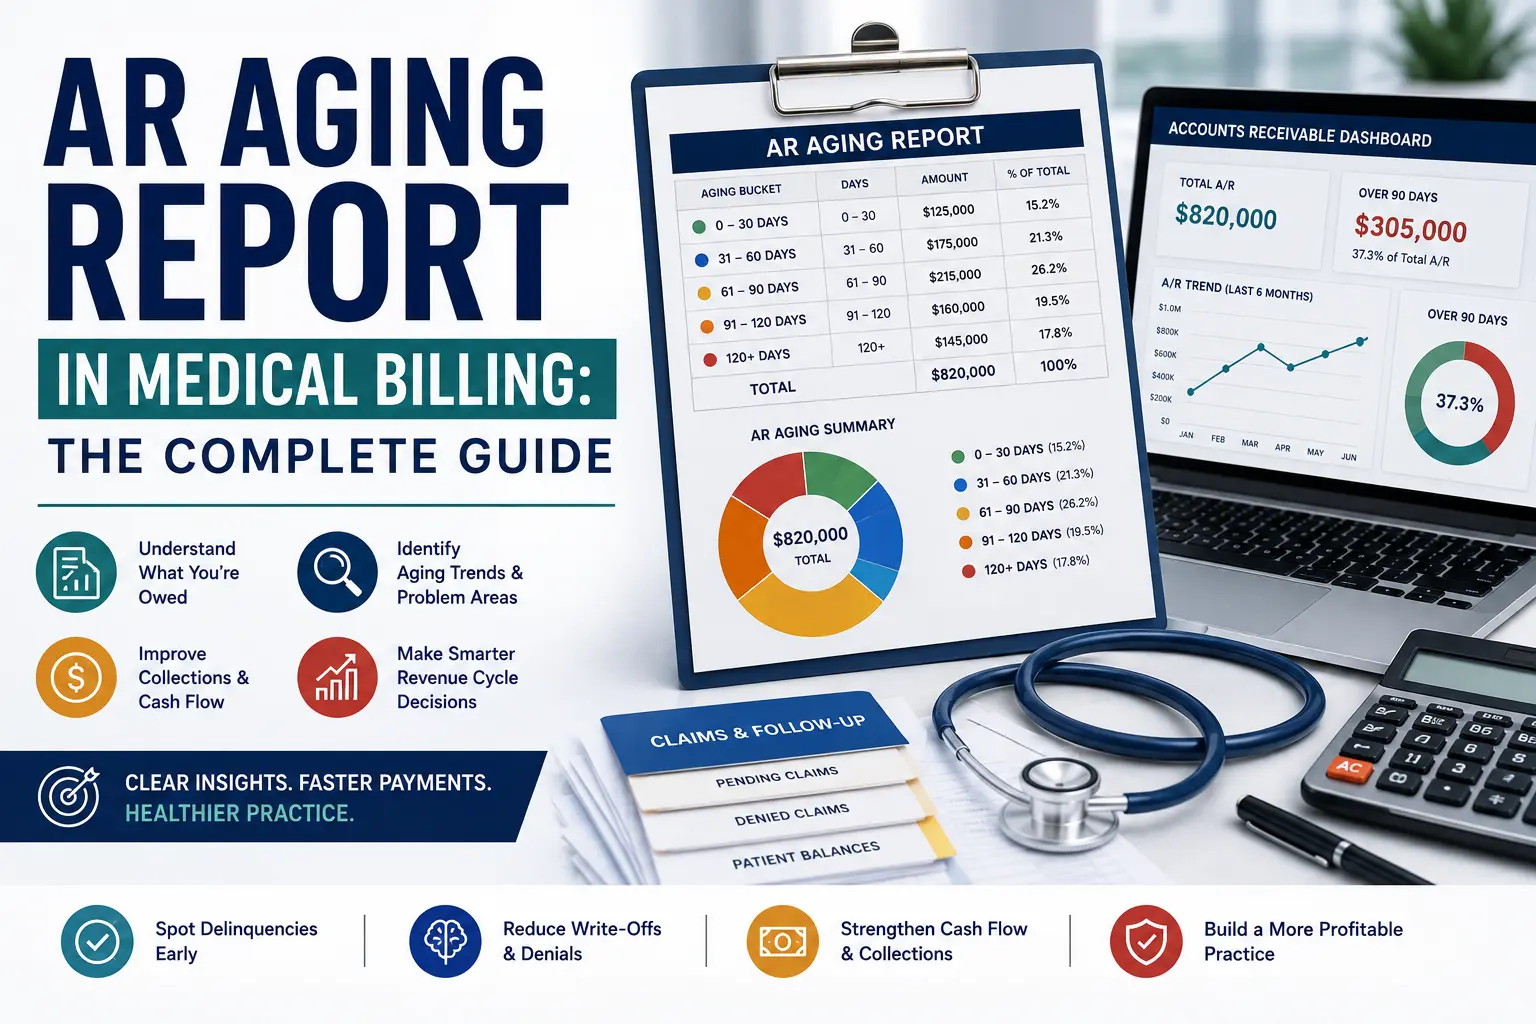
Quick answer: An AR aging report in medical billing is a snapshot of every unpaid insurance claim and patient balance, sorted by how many days it has sat unpaid since the date of service. It groups those balances into time buckets, usually 0-30, 31-60, 61-90, and 90+ days, so a billing team can see at a glance which accounts still have a normal chance of getting paid and which ones are quietly turning into lost revenue. Practices that keep more than 65% of their AR inside the 0-30 day bucket and less than 15% past 90 days are generally considered financially healthy.
That one paragraph answers the question. The rest of this guide is for the practice owner, billing manager, or CFO who needs to actually do something with that report, not just define it.
There is a specific moment every billing manager knows. You pull the aging report on a Monday morning, and one column has grown again. Not dramatically, just a little wider than last month. Nobody caused it on purpose. A few claims sat too long with an insurance company. A denial got missed. A patient statement never landed. But that quiet drift, week after week, is how a practice with a full patient schedule ends up short on cash anyway.
The AR aging report is the tool that catches that drift before it becomes a real problem. Here is everything you need to actually use it, not just understand it.
What Is an AR Aging Report in Medical Billing?
An AR aging report, short for accounts receivable aging report, is a structured breakdown of every outstanding balance owed to a healthcare practice, organized by the length of time each balance has remained unpaid. It pulls directly from your practice management system and updates as claims move through the payer’s adjudication process.
Every unpaid claim or patient balance lands in one of several aging buckets based on the number of days since the date of service, not the date the claim was submitted. That distinction matters more than most billing staff realize, since a claim that sat unbilled internally for two weeks is already aging by the time it even reaches a payer.
Two categories of money show up on this report:
- Insurance AR — claims submitted to Medicare, Medicaid, and commercial payers that have not yet been paid, denied, or fully adjudicated.
- Patient AR — copays, deductibles, coinsurance, and self-pay balances owed directly by the patient.
Both need separate attention, because the follow-up strategy for a slow-paying insurance company looks nothing like the follow-up strategy for a patient who hasn’t opened their statement yet.
Why the AR Aging Report Matters More Than a Simple Balance
A total AR figure on its own tells you almost nothing useful. A practice sitting on $300,000 in outstanding receivables could be in excellent shape or in serious trouble, and the number alone won’t tell you which. What matters is where that $300,000 sits.
If most of it is inside the 0-30 day bucket, it’s simply revenue that is still moving through a normal payer cycle. If a large share has drifted into the 90+ day bucket, a meaningful chunk of it is at real risk of never being collected at all. Claims that cross a payer’s timely filing limit become permanently uncollectible, no matter how clean the original claim was.
This is exactly why finance leadership treats this report as more than a billing department tool. It feeds cash flow forecasts, bad debt reserves, and even payer contract negotiations. Our separate breakdown of why CFOs analyze aging accounts receivable covers that finance-side view in more depth if you want to understand how leadership reads the same numbers differently than a billing specialist does.
Key Components of an AR Aging Report
A complete AR aging report includes more than just dollar figures in columns. A properly built report gives billing staff everything they need to act without pulling a second document. Look for these fields:
- Patient and payer information — who owes the money and who is responsible for it
- Date of service — the anchor point every aging bucket is calculated from
- Claim submission date — when the claim actually left the building
- Outstanding balance — split between insurance responsibility and patient responsibility
- Aging bucket classification — which time range the balance currently falls into
- Claim or denial status — whether the claim is pending, denied, or partially paid, and why
- Follow-up history — prior contact attempts, dates, and notes so nobody duplicates work
- Timely filing deadline — the date after which the claim can no longer be appealed or resubmitted
If your current report is missing several of these fields, staff are almost certainly duplicating effort by hunting for information in a separate system before they can even start working an account.
AR Aging Buckets Explained
The buckets are the backbone of the entire report. Each range signals a different level of urgency and a different recommended action.
| Aging Bucket | What It Usually Means | Collection Risk | Recommended Action |
|---|---|---|---|
| 0-30 days | Recently billed, still inside a normal payer response window | Very low | Monitor only, no action needed yet |
| 31-60 days | Payment is late but still routinely collectible | Low to moderate | Confirm receipt, request an adjudication timeline |
| 61-90 days | Something is delaying payment, often a denial or a stalled claim | High | Pull the EOB/ERA, identify the denial reason, resubmit or appeal |
| 91-120 days | Approaching or past most timely filing limits | Very high | Escalate immediately, involve a senior collector or payer relations |
| 120+ days | At or beyond nearly every payer’s filing window | Critical | Final appeal, formal write-off review, or collections referral |
A useful rule of thumb: once a claim crosses 60 days with no documented follow-up, it stops being a routine account and starts being a risk that needs a name attached to it. Letting the practice management system carry it silently is how claims slip past timely filing without anyone noticing until it’s too late.
What a Healthy Aging Distribution Looks Like
Percentages matter more than raw dollar amounts, since totals can hide a shift toward older, riskier balances even when the top-line number looks stable.
| Aging Bucket | Healthy Target (% of Total AR) |
|---|---|
| 0-30 days | 55-65% |
| 31-60 days | 20-25% |
| 61-90 days | 8-12% |
| 90+ days combined | Under 15% |
If your 90+ day bucket regularly climbs past 20%, that’s rarely a one-off issue. It’s usually a sign of a structural problem somewhere upstream, whether that’s understaffed follow-up, a pattern of unworked denials, or gaps at insurance eligibility verification that keep generating claims that were never going to pay cleanly in the first place.
Types of AR Aging Reports Used in Medical Billing
Not every practice needs to run every version of this report, but knowing they exist helps you ask for the right cut of data when something looks off.
- Insurance AR aging report — the most commonly used version, tracking claims owed by Medicare, Medicaid, and commercial payers
- Patient AR aging report — tracks copays, deductibles, and self-pay balances, increasingly important as high-deductible plans become the norm
- Payer-wise aging report — breaks AR down by individual insurance company, useful for spotting which payer is consistently slow or denial-heavy
- Provider-wise aging report — useful in multi-provider groups to see whether one physician’s documentation habits are driving more denials than the rest
- Service-line aging report — breaks AR down by department or specialty, helpful for larger organizations running multiple service lines
A Realistic AR Aging Report Example
Here’s what a mid-sized practice’s aging report might actually look like, broken down by payer category:
| Payer Category | 0-30 Days | 31-60 Days | 61-90 Days | 90+ Days | Total AR |
|---|---|---|---|---|---|
| Medicare | $12,400 | $4,300 | $1,800 | $700 | $19,200 |
| Medicaid | $7,900 | $3,100 | $2,000 | $1,600 | $14,600 |
| Commercial | $15,600 | $5,200 | $2,100 | $900 | $23,800 |
| Self-Pay/Patient | $4,200 | $2,300 | $1,400 | $1,100 | $9,000 |
| Total | $40,100 | $14,900 | $7,300 | $4,300 | $66,600 |
Reading This Report Like a Billing Analyst Would
- Overall picture: $40,100 (60%) sits in the 0-30 day bucket, which is a healthy baseline. Only 6.5% is past 90 days, comfortably under the 15% warning line.
- Medicaid stands out: Medicaid carries the highest proportion of aged AR relative to its size, with $1,600 sitting past 90 days out of a $14,600 total. That’s worth investigating on its own, since Medicaid often has tighter documentation and authorization rules than commercial payers.
- Patient AR needs attention: $1,100 of self-pay balance is already past 90 days. Without a structured payment plan or reminder system, this is the bucket most likely to end up written off entirely.
- Commercial and Medicare look strong: Both payer categories show a healthy concentration in the earliest bucket, suggesting the front-end process, coding and eligibility checks, is working well for these claim types.
How to Analyze an AR Aging Report, Step by Step
Reading the report is one skill. Acting on it consistently is a different one. Here is the process high-performing billing teams actually follow, not just glance through.
- Start with the 90+ day bucket, not the newest claims. These accounts carry the highest financial risk and the tightest deadlines. Review each one individually and decide: appeal, resubmit, or escalate.
- Work the 61-90 day bucket for denial patterns. Pull the EOB or ERA for each account. If several claims share the same denial reason, you’re looking at a process problem, not isolated bad luck.
- Confirm receipt on 31-60 day claims. A quick payer portal check or call confirms the claim is in process and gives you a documented follow-up date, rather than letting it silently drift into the next bucket.
- Let 0-30 day claims run their normal course. These don’t need active chasing yet, just confirmation they were submitted and accepted by the clearinghouse.
- Segment by payer every time. A payer consistently dominating the older buckets points to a payer-side pattern worth raising with provider relations or factoring into contract renewal decisions.
- Document everything. Every follow-up attempt, denial reason, and resubmission date should live in the system, both for your own team’s continuity and for audit purposes.
- Report the trend, not just the snapshot. A single month’s numbers matter less than whether the 90+ day percentage is climbing or shrinking over the last quarter.
The Metrics Behind the Report
An aging report becomes far more useful once you pair it with the handful of metrics that explain why the buckets look the way they do.
Days in AR Formula: Total AR ÷ (Total charges over the last 90 days ÷ 90) A practice holding $300,000 in AR with $900,000 billed over the last quarter has an average daily charge of $10,000, putting Days in AR at 30, solidly inside the high-performer range. For a deeper walkthrough of this specific metric, our accounts receivable process guide covers the full calculation with several worked examples.
Net Collection Rate Formula: Payments ÷ (Charges − Contractual Adjustments) × 100 This tells you what percentage of collectible revenue you’re actually keeping. See our full net collection rate guide for the complete formula and benchmark breakdown.
Clean Claim Rate Formula: Claims accepted without rejection ÷ Total claims submitted × 100 A strong clean claim rate is the single biggest lever for keeping claims out of the aging buckets in the first place, since a claim that never bounces never has a reason to sit unpaid.
Denial Rate Formula: Denied claims ÷ Total claims submitted × 100 An unmanaged denial rate is one of the fastest ways to inflate the older aging buckets, since every unworked denial is a balance that stops moving forward.
2026 Industry Benchmarks
| Metric | Best-in-Class | Acceptable | Needs Attention |
|---|---|---|---|
| Days in AR | Under 30 | 30-40 | Over 50 |
| Net Collection Rate | 98%+ | 95-98% | Below 95% |
| 90+ Day AR Percentage | Under 10% | 10-15% | Over 20% |
| Clean Claim Rate | 98%+ | 95-98% | Below 95% |
| Denial Rate | Under 5% | 5-10% | Over 10% |
AR Days Benchmarks by Specialty
One thing most guides on this topic skip entirely: the same 30-40 day benchmark doesn’t apply evenly across every specialty. Practices with more complex authorization requirements or longer claim review cycles naturally run higher.
| Specialty | Typical Days in AR |
|---|---|
| Primary care / family medicine | 28-35 days |
| Internal medicine | 30-38 days |
| Behavioral and mental health | 35-45 days |
| Orthopedics and surgical specialties | 38-48 days |
| DME (durable medical equipment) | 40-55 days |
| Ambulatory surgery centers | 35-45 days |
If your specialty naturally runs higher, that’s not automatically a red flag. What matters is whether you’re tracking close to your specialty’s typical range or drifting well above it. A DME practice sitting at 50 days is performing fine. A primary care practice sitting at 50 days has a real problem worth investigating, and our DME billing guide goes deeper into the specific authorization and documentation hurdles that push DME AR higher than most other specialties.
What Causes AR Aging to Increase
Rising AR days rarely happen for one obvious reason. Usually it’s a combination of smaller issues compounding over several billing cycles.
- Unworked claim denials. Every denial that sits without a follow-up plan is a balance frozen in place, and the longer it sits, the harder it becomes to overturn.
- Eligibility verification gaps. Coverage that lapsed, wrong subscriber IDs, or plans that changed since the last visit all create denials that were preventable at the front desk.
- Coding errors. Mismatched CPT and ICD-10 pairings or missing modifiers trigger edits or outright rejections that add weeks to the collection timeline.
- Missing prior authorization. Authorization-related denials are among the hardest to overturn after the fact, particularly with commercial payers and Medicare Advantage plans.
- Incomplete clinical documentation. When the chart doesn’t support the billed code, payers deny or downcode the claim, sending it back to the provider before it can even be corrected.
- Payer-side delays. Not every aging problem originates on the provider’s side. Some payers, particularly certain Medicaid managed care plans, run consistently slower adjudication timelines regardless of how clean the claim was.
- Understaffed follow-up. When AR specialists are stretched across too many accounts, the oldest, most at-risk claims are usually the ones that get neglected first, since newer claims feel more urgent day to day.
Most of these trace back further than the billing department itself. If revenue is consistently slipping through cracks across multiple stages of the cycle, it’s worth reading through our guide on revenue leakage in medical billing, which covers how these smaller issues compound into much larger losses over a full year.
Common Mistakes Practices Make With Their Aging Report
- Looking only at the total dollar figure, which hides deterioration in the older buckets even when the headline number looks stable
- Reviewing aging in isolation from denial data, missing the actual root cause behind why balances are aging
- Treating the 90+ day bucket as a monthly cleanup task instead of a daily priority
- No payer segmentation, which makes it nearly impossible to tell whether a problem is systemic or specific to one insurance company
- Skipping documentation on follow-up attempts, which means the next person to touch that account has to start from zero
A structured medical billing audit once or twice a year is one of the more reliable ways to catch these patterns before they become permanent habits on your team.
AR Aging Report vs. AR Follow-Up Report
These two reports work together but answer different questions, and mixing them up is a common source of confusion for newer billing staff.
| AR Aging Report | AR Follow-Up Report | |
|---|---|---|
| Shows | How much is owed and how old it is | What action has been taken on each account |
| Orientation | Backward-looking, current balance snapshot | Forward-looking, tracks resolution progress |
| Generated by | Practice management system automatically | Billing staff, updated with each contact |
| Answers | “Where is the risk concentrated?” | “Is someone actually working this account?” |
The aging report tells you where to look. The follow-up report proves something is actually being done about it. A practice running only one of the two is missing half the picture.
Best Practices to Keep AR Aging Under Control
- Verify eligibility before every visit, not just for new patients. Coverage changes far more often than most practices assume.
- Build timely filing tracking into your workflow, with automated alerts before a claim’s deadline arrives, not after.
- Run a formal denial management process that categorizes denial reasons and feeds patterns back to coding and front-desk staff. Our claim denial management guide walks through building that process from the ground up.
- Hold a weekly AR review, even a short one, where the team walks through each aging bucket and assigns clear ownership for aged accounts.
- Automate patient billing communication through statements, portals, and payment plan options, since patient AR is one of the fastest-growing categories on most practices’ reports.
- Segment reporting by payer monthly, not just quarterly, so a slow-paying payer gets flagged before it drags down your averages for months.
- Keep documentation consistent across every follow-up attempt so accounts never lose continuity between staff members or shifts.
Technology’s Role in Modern AR Management
Manually tracking aging buckets in a spreadsheet works for a handful of providers. It falls apart quickly past that scale. Most practice management systems today can flag aging thresholds automatically, surface denial patterns by reason code, and generate payer-specific worklists without manual sorting. If your current setup still relies on someone manually pulling and formatting this data every week, it’s worth reviewing our comparison of medical billing software options to see what a properly integrated system should be doing for you automatically.
AI-assisted denial prediction is also becoming standard in more advanced platforms, flagging claims likely to be denied before submission rather than after, which is a meaningfully different approach than the reactive follow-up model most practices still run today.
When to Bring in Outside Help
Some practices manage AR effectively in-house indefinitely. Others reach a point where internal capacity simply can’t keep pace with claim volume. A few signals usually point toward outsourcing being worth a serious look:
- Days in AR has been climbing for two or more consecutive quarters
- Claims are regularly missing timely filing deadlines
- Denials sit unassigned because no one consistently owns follow-up
- Your team can’t tell you, on demand, what percentage of AR is past 90 days
None of that means losing visibility into your own numbers. A properly run partnership through AR follow-up services or full medical billing services still gives you regular, transparent reporting, just handled by a team whose only job is keeping those buckets from drifting.
Frequently Asked Questions
What is an AR aging report in medical billing? It’s a report that sorts every unpaid insurance claim and patient balance by how long it has been outstanding since the date of service, typically grouped into 0-30, 31-60, 61-90, and 90+ day buckets, so billing teams can prioritize follow-up based on urgency and risk.
What percentage of AR should be in the 0-30 day bucket? Most well-run practices keep 55-65% of total AR inside the 0-30 day range. A lower percentage usually points to submission delays or a backlog of aging claims that haven’t been actively worked.
What’s the difference between Days in AR and an AR aging report? Days in AR is a single average number showing how long it typically takes to collect payment. The AR aging report shows the full distribution behind that average, revealing exactly where the risk is concentrated rather than just an overall figure.
How often should an AR aging report be reviewed? Daily or weekly by billing staff actively working accounts, and at least monthly at a management level to track trends across the whole aging distribution rather than a single snapshot.
What causes claims to end up in the 90+ day bucket? Unworked denials, missed timely filing deadlines, coding errors that require resubmission, missing prior authorizations, incomplete documentation, and understaffed follow-up teams are the most common causes.
Is a high AR aging percentage always the billing team’s fault? Not always. Some payers run consistently slower adjudication timelines regardless of claim quality. Segmenting the report by payer is the only reliable way to tell whether a problem originates internally or on the payer’s side.
Should patient AR and insurance AR be reviewed separately? Yes. They require completely different follow-up approaches, insurance AR needs payer contact and appeals, while patient AR needs clear statements, payment plans, and consistent reminder communication.
Final Thoughts
An AR aging report only creates value when someone actually acts on it, consistently, bucket by bucket, week after week. The practices that keep their AR days low aren’t the ones with the fanciest software. They’re the ones that treat this report as a daily working document instead of a monthly formality glanced at right before a meeting.
If your report has more sitting in the 90+ day bucket than it should, or your team struggles to tell you exactly where the risk is concentrated, that’s usually the clearest sign the process needs a closer look before more revenue quietly ages out of reach. Contact our team to have your current aging report reviewed and find out exactly where the gaps are.