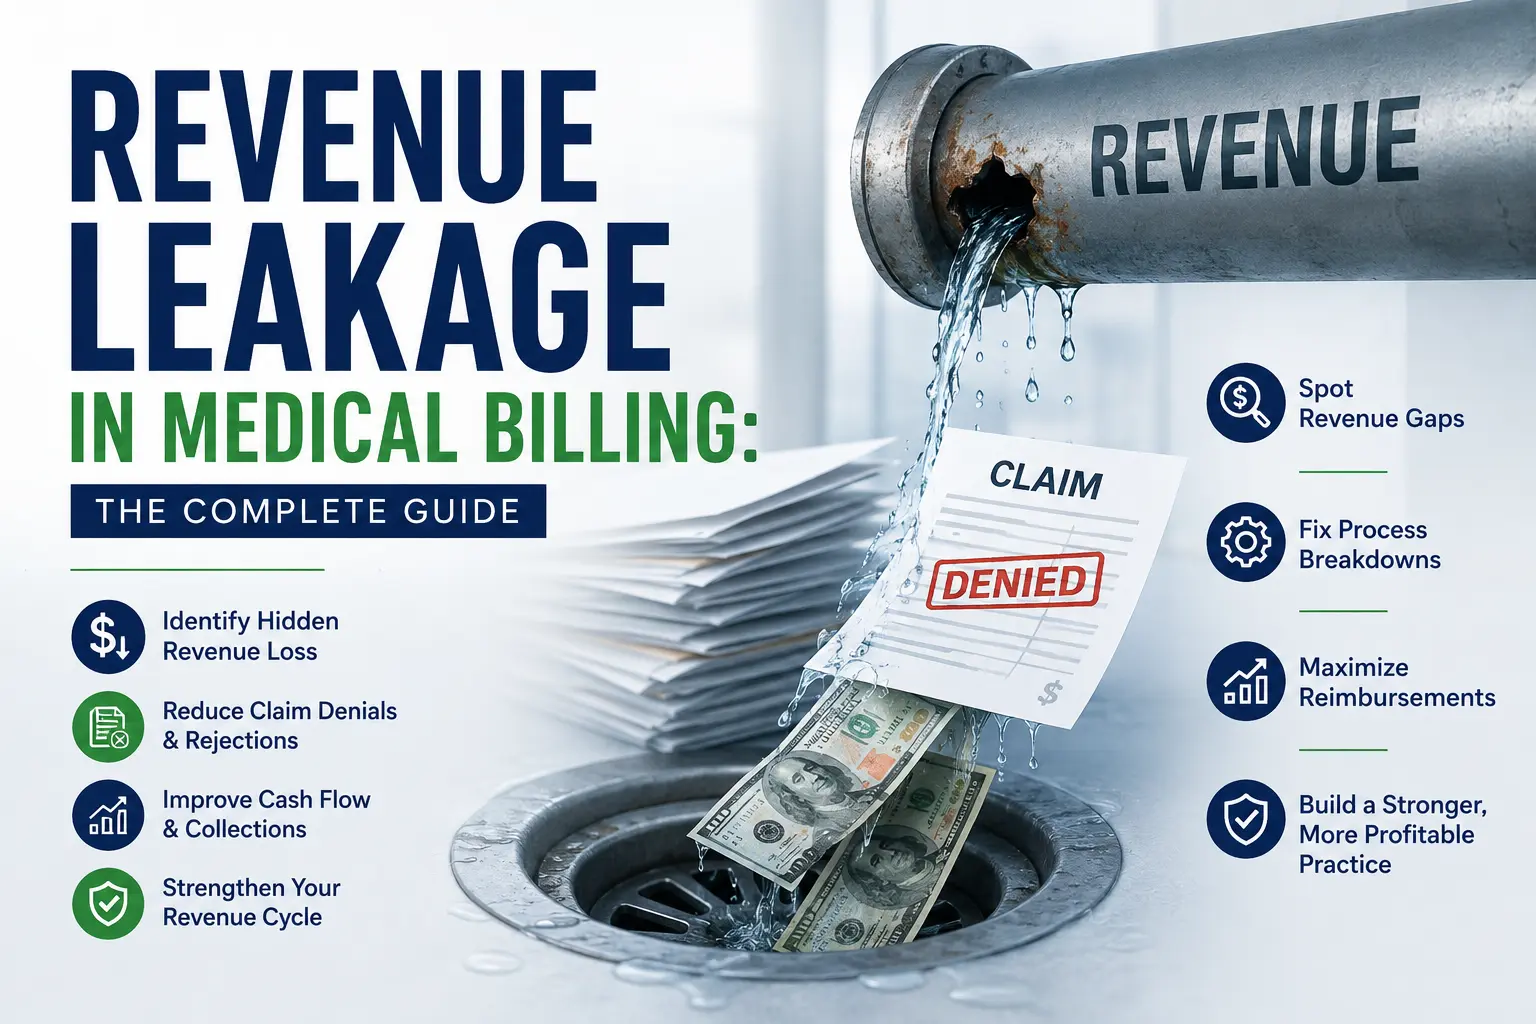
Most practices find out about revenue leakage the wrong way. Not from an audit, not from a dashboard, but from a slow, uneasy feeling that the money coming in doesn’t match the work going out. Visit volume looks fine. Staff are busy. The bank balance still feels tight.
That gap between effort and income has a name. It’s revenue leakage, and in 2026 it has stopped being a background nuisance and become one of the biggest threats to a practice’s financial stability.
What Is Revenue Leakage in Medical Billing?
Revenue leakage is money a practice has legitimately earned for care it delivered, but never actually collects, because a process step failed somewhere between the front desk and the final payment. It is not the same as a discount you chose to give, and it is not the same as bad debt from a patient who genuinely cannot pay. Leakage is revenue you were owed that simply disappeared through a gap nobody was watching.
Industry estimates put that gap at 3% to 5% of net patient revenue for the average practice, and independent research from the Medical Group Management Association points to hidden leakage as high as 3% to 7% of collections, most of which never shows up on a standard denial report. For a practice billing $4 million a year, even the low end of that range is well over $100,000 walking out the door annually, and nobody signs a memo when it happens.
Revenue Leakage vs. Denials vs. Bad Debt: Know the Difference
These three terms get used interchangeably, and that confusion is exactly why leakage stays hidden. They are not the same thing.
| Term | What It Means | Does It Show Up on a Report? |
|---|---|---|
| Revenue leakage | Earned revenue lost to a process gap (eligibility miss, undercoding, unworked denial, silent underpayment) | Usually not, until someone goes looking |
| Claim denial | A claim rejected outright by the payer for a specific, coded reason | Yes, on the denial report |
| Underpayment | A claim paid, but below the contracted rate | Rarely, unless payments are reconciled against the fee schedule |
| Bad debt | A patient balance that is unlikely to ever be collected due to inability to pay | Yes, in AR aging |
| Write-off | A deliberate, documented reduction in what’s owed (contractual adjustment, charity care) | Yes, and it’s intentional |
The reason this distinction matters is simple: denials and bad debt already have owners and workflows in most practices. Leakage lives in the space between those workflows, in claims that pay less than contracted, coding that never triggers a rejection, and referrals that never turn into a scheduled visit.
Why Revenue Leakage Looks Different in 2026
Leakage has always existed, but three shifts have made it materially worse this year.
Hospitals are already feeling it at scale. Kodiak Solutions’ “State of the Healthcare Revenue Cycle” report, built from data across 2,300 hospitals and 350,000 physicians, found that net revenue leakage jumped 25% from 2024 to 2025, with denials and uncompensated care together accounting for more than $48 billion in losses, up from $38.6 billion the year before. The median final denial rate rose from 2.5% to 2.7% over the same period, driven almost entirely by clinical denials for lack of prior authorization and medical necessity.
Patient access itself has become a revenue leak. A 2026 survey of hospital CFOs and COOs found that wait times and patient abandonment alone account for roughly 27% of access-related revenue loss, with fragmented workflows and referral loop failures close behind. Health systems in the bottom quartile for referral leakage lose an estimated $110 million in organizational value over five years compared to top performers. Leakage, in other words, doesn’t start at the billing desk. It starts the moment a patient tries to get an appointment.
Payer behavior has tightened. ACA subsidy changes, stricter Medicaid eligibility rules, and more aggressive utilization management are all pushing more claims into the “needs prior auth” or “medical necessity review” bucket, which is precisely where leakage hides best, because these denials look like normal billing friction rather than a systemic problem.
Where Revenue Leakage Actually Starts: Mapping the Full Cycle
The biggest mistake practices make is treating leakage as a billing-office problem. It isn’t. It’s a life cycle problem that touches every stage a patient moves through.
Front door (scheduling and access). A referral that never converts into a booked appointment, a patient who abandons a long hold queue, an eligibility check skipped during a busy morning. None of this ever reaches a claim, so it never shows up as a denial. It just shows up as a visit that never happened. A consistent insurance eligibility verification process at intake closes most of this gap before it starts.
Mid-cycle (documentation, coding, charge capture). This is where undercoding lives. A provider spends real time on a complex visit but codes it as routine to stay comfortably under audit risk, and the claim pays correctly for what was billed, just not for what was actually done. Nothing looks wrong on the remittance, which is exactly why this is one of the hardest leaks to catch without a structured charge capture review tied directly to clinical documentation.
Claim submission and adjudication. Missing modifiers, mismatched patient demographics, and authorization gaps generate denials that are visible, but only if someone works them. Industry data from HFMA suggests 60% to 65% of denied claims are never reworked at all before they age past the appeal window, which turns a fixable denial into permanent leakage.
Payment posting and reconciliation. A claim that pays but pays below the contracted rate is a silent leak. The payment poster marks it paid, moves to the next claim, and the difference between what was billed and what was owed never gets flagged unless someone is actively reconciling against the fee schedule.
Aged accounts receivable. Every day a claim sits past 90 days without follow-up, the odds of collecting it drop. Past 120 days, recovery rates fall to roughly 10 cents on the dollar. If your team can’t say, on demand, what your AR over 90 days looks like by payer, that number is quietly becoming a write-off. Our guide on why CFOs analyze aging accounts receivable breaks down exactly how to keep that visibility.
How to Calculate Your Revenue Leakage Rate
Most articles on this topic throw out a national percentage and stop there. That number is useless until you apply it to your own numbers. Here’s the formula:
Revenue Leakage Rate = (Expected Net Revenue − Actual Collected Revenue) ÷ Expected Net Revenue × 100
To use it, you need one number most practices have never calculated: expected net revenue. Build it by taking your total charges for a defined period, applying your correct, audited coding levels rather than what was actually billed, and then applying your contracted rates rather than list price. That figure is what you should have collected. Compare it to what actually landed in the bank for the same period, and the gap is your leakage rate.
A practice that runs this calculation quarterly, by location and by provider rather than as one blended number, almost always finds outliers hiding inside an average that looked fine. Our net collection rate guide and clean claim rate guide cover two of the supporting metrics that feed directly into this calculation.
Revenue Leakage Benchmarks by Practice Type
| Setting | Typical Leakage Rate | Primary Driver |
|---|---|---|
| Solo / small practice | 3% – 7% of collections | Coding drift, unworked denials, missed follow-up |
| Multi-provider physician group | 3.5% – 4.2% of net revenue | Front-desk inconsistency across locations, fee schedule drift |
| Hospital / health system | 2.5% – 2.7% median final denial rate, up 25% YoY in net leakage | Clinical denials for prior auth and medical necessity |
Groups running more than five providers or multiple locations tend to leak more, not because staff are weaker, but because more providers, more front-desk teams, and more payer contracts create more seams for revenue to slip through. If that’s your practice, our physician group revenue leakage prevention guide walks through a governance framework built specifically for multi-location groups.
How to Detect Revenue Leakage Before It Compounds
Detection is a discipline, not a one-time project. A working audit cycle looks like this:
- Pull unblended data. Denial rate, first-pass resolution rate, and AR aging broken out by provider, location, and payer. Blended averages are where outliers hide.
- Sample-audit your coding. Take a random set of claims from the last 90 days and compare the clinical note to the code billed. This is the fastest way to catch undercoding, and it pairs directly with a structured medical billing audit checklist.
- Reconcile payments against contracts. Check a sample of paid claims against your actual fee schedule, not what you assume the rate is. Underpayments rarely announce themselves.
- Review your denial-to-appeal ratio. If a meaningful share of denials never get reworked, that’s leakage with a name and a deadline attached, and it’s worth building out a proper claim denial management workflow around it.
- Check the front door. Are eligibility checks and prior authorizations happening consistently, or only when the front desk isn’t slammed? A tightened patient registration process closes more downstream leakage than almost any single billing fix.
The Role of Technology and AI in Closing Leaks
Manual audits catch leakage 45 to 90 days after it happens, on average. By then, some of it is already past the appeal window. AI-assisted claim scrubbing, real-time eligibility checks, and automated fee-schedule reconciliation compress that detection window dramatically, because they flag anomalies as claims move through the cycle instead of after the fact. That said, technology closes gaps only when the underlying data feeding it is clean. A practice running two or three disconnected systems that were never properly reconciled will still leak, no matter how sophisticated the software layered on top is. Standardizing on the right medical billing software is the foundation that makes AI-assisted detection actually work.
Building Revenue Integrity, Not Just Plugging Leaks
Fixing leakage once is an audit. Keeping it fixed is a discipline, and the industry term for that discipline is revenue integrity: the ongoing practice of making sure every dollar earned is captured, coded, billed, and collected correctly the first time. Our guide on revenue integrity in healthcare covers how to build that into your practice’s operating rhythm rather than treating it as an annual event. It pairs naturally with a broader understanding of what RCM in medical billing actually covers end to end, and with staying ahead of the most common medical billing mistakes that quietly feed into leakage month after month.
Build In-House or Bring in a Partner
A practice with a small, stable team and strong internal reporting can often manage leakage detection in-house. The math changes once you’re managing multiple payers across multiple specialties, or growing faster than your internal team’s bandwidth. At that point, a dedicated revenue cycle management partner with active AR follow-up, structured denial management, and ongoing credentialing support closes leaks faster than most internal teams can build the same discipline from scratch, simply because it’s their full-time job rather than one more task on a packed front-desk schedule.
Frequently Asked Questions
What is revenue leakage in medical billing?
Revenue leakage is earned revenue a practice fails to collect due to process gaps like undercoding, unworked denials, missed eligibility checks, or unreconciled underpayments. It differs from bad debt, which involves patients who genuinely cannot pay.
How do you calculate a revenue leakage rate?
Subtract actual collected revenue from expected net revenue (calculated using correct coding and contracted rates), then divide by expected net revenue and multiply by 100. Run this by provider and location, not as one blended practice-wide number.
What is a healthy revenue leakage rate?
Under 2% of net patient revenue is considered strong for most practices in 2026. Rates above 4% to 5% signal systemic process gaps rather than isolated errors.
Is revenue leakage the same as claim denials?
No. Denials are one visible, trackable source of leakage. Underpayments, undercoding, unworked denials, and referral loop failures are equally significant but far less visible, which is why they’re often missed entirely.
How often should a practice audit for revenue leakage?
Quarterly at minimum, with denial and underpayment trends reviewed monthly. Annual audits catch leakage only after it has already compounded into a much larger loss.
Can AI actually prevent revenue leakage?
AI-assisted claim scrubbing and real-time eligibility checks shrink the detection window from months to days, but only when paired with clean, integrated data. Technology speeds up detection; it doesn’t replace the underlying process discipline.
The Bottom Line
Revenue leakage rarely announces itself with one dramatic failure. It builds quietly across scheduling, coding, claim submission, payment posting, and AR follow-up, and by the time it’s visible in your bank balance, it has already been compounding for months. The practices that keep the least amount on the table are the ones that measure their leakage rate on purpose, audit by provider and location instead of in aggregate, and treat prevention as a recurring discipline rather than a once-a-year clean-up project.
If you’ve never calculated your own leakage rate, that’s the place to start. The team at The Billing Advisors works with practices of every size to find exactly where revenue is slipping through, and close it for good.